Checking Generalization Without Test and Validation Sets
Sunday, 29 September, 2019(Note: This article assumes you know your Machine Learning. By that I mean, you need to understand what a model is, what is meant by the three critical terms of Machine Learning modeling viz. overfitting, underfitting and generalization.)
Any decent book on Machine Learning will tell you that the endgame is to construct a good model. A good model should not underfit i.e. fail to capture the real patterns present in your data. A good model should not overfit i.e. it should not capture noise instead of real patterns. A good model should be just right. When this happens, the model is said to generalize well.
So, how does one go about ensuring that the model does indeed generalize well? This too is Machine Learning 101. You divide your data into a training and test set. You train the model using the training data and keep monitoring the metric of your interest on the test. When you get a model that achieves minimal desired performance on the training set without compromising the performance on the test set, your model can be said to generalize well.
But imagine you are a scientist, say an astronomer. And as an astronomer, you manage to study some 30 galaxies and painfully measure two of their properties X and Y. You make a plot and find a linear relationship and now you would to do linear regression in order to model the relationship between X and Y. You feed your data to one of these many routines available and get back the slope & intercept of the line. Now, how do you determine if your fit 'generalizes' well? You do not have the luxury of splitting this simple 30 points data set into a training and test set! When this question is posed to Machine Learning engineers (note the word 'engineer'), my guess is that they will start coming up with exotic methods of upsampling etc.
It turns out that the solution to the problem exists in the field of Statistics since more than four decades. To understand this solution however one needs to go to the basics. First off, you need to understand the Principle of Maximum Likelihood. This principle says that 'right model parameters' are those which maximize the likelihood (probability) of getting the current data set. If you apply this principle under the following assumptions
- that the error on Y is a Gaussian
- that each measurement is independent
- and that all errors on Y are equal (isoskedasticity)
the principle will ask you to do a least squares! If you relax the last assumption, then what you get is something known as chi-square. Here is how it works.
$$ \chi^2 = \sum_{i=1}^N \left( \frac{y_i - \hat{y}^2 }{\sigma_i} \right)^2 $$
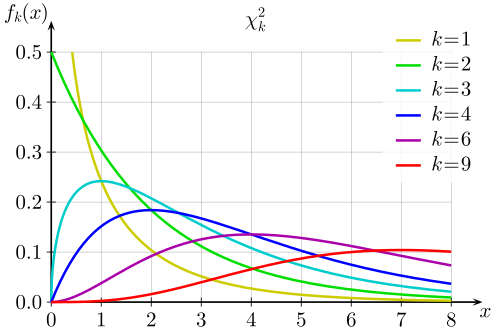
Now, since our measurements yis are Gaussian random variables, chi-square is also a random variable. This is because it is the sum of the squares of random variables. Now, it turns out that geniuses from the past have determined the exact probability distribution that such a quantity is expected to follow. This distribution is known as a chi-square distribution. It has a complex mathematical form. It looks something like this:
$$ \chi^2(x) = \frac{x^{k/2-1}\ e^{-x/2}}{2^{k/2}\ \Gamma(k/2)} $$
But let's look at the curve for various values of 'k', a parameter of the distribution called degrees of freedom.
We can divide our chi-square by 'k' and get something called reduced chi-square. This would be mathematically written as,
$$ \chi^2_{k} = \frac{\chi^2}{k} $$
This reduced chi-square, as we call it, has the property that its expectation or average value is one.
$$ \left< \chi^2_{k} \right> = 1 $$
So, if your model is correct, what this distribution is telling you is that there are some values of chi-square which are more probable than others.
So, let's say that you get a reduced chi-square which is far greater than 1. Given the correct model, the chances of this happening are very low. Thus we say that the model is underfitting. Note that generally for chi-square to be very large, there has to be a strong disagreement between the predicted values of the model and the actual values of the model.
Consider the opposite case. You get a reduced chi-squared which is far less than one. Given the correct model, the probability of this happening is also far too low. The model is then said to be overfitting. Note that generally for chi-square to be very low, the predicted values of the model are almost equal to the actual values.
There you have it! A several decades old solution to commenting on overfitting and underfitting without doing a train-test split! Now, I completely acknowledge that you must be dazed and confused. That is because we have skipped a lot of details. There are textbooks written on this topic. My job was to merely present a condensed description of how statistics enables the answer to my original question.
But if you are interested in a more detail explanation by me, there is a video recording of my lecture on this topic available at the link below.
Probability Distributions: What They Are And How Scientists Use Them (talk delivered at PyData Pune April 2019 Meeting)